Expected Outputs from HBCD-EEG-Utilities.m🔗
HBCD-EEG-Utilities.m writes the following output files:
|__ made/
    |__ sub-<label>/ #individual subject folder
    |    |
    |    | # FACE
    |    |__ sub-<ID>_ses-V03_task-FACE-ERPSummaryStats.csv
    |    |__ sub-<ID>_ses-V03_task-FACE-ERPTrialMeasures.csv
    |    |
    |    | # MMN
    |    |__ sub-<ID>_ses-V03_task-MMN-ERPSummaryStats.csv
    |    |__ sub-<ID>_ses-V03_task-MMN-ERPTrialMeasures.csv
    |    |
    |    | # VEP
    |    |__ sub-<ID>_ses-V03_task-VEP-SummaryStats.csv
    |    |__ sub-<ID>_ses-V03_task-VEP-ERPTrialMeasures.csv
    |    |
    |    | # RS
    |    |__ sub-<ID>_ses-V03_task-RS-LogPowerSpectra.csv
    |    |__ sub-<ID>_ses-V03_task-RS-AbsPowerSpectra.csv
    |    |__ sub-<ID>_ses-V03_task-RS-dbPowerSpectra.csv
    |    |__ sub-<ID>_ses-V03_task-RS-spectra.mat
    |    |__ sub-<ID>_ses-V03_task-RS-desc-allCh_PSD.jpg
    |
    |__ Concatenated outputs for ERPs/ #output folder created by HBCD-EEG-Utilities.m
        |
        | # MMN
        |__MMN_ERP_V03_<yyyy-mm-dd>.csv
        |__MMN_trialMeasures_V03_<yyyy-mm-dd>.csv
        |
        | # FACE
        |__FACE_ERP_V03_<yyyy-mm-dd>.csv
        |__FACE_trialMeasures_V03_<yyyy-mm-dd>.csv
        |
        | # VEP
        |__VEP_ERP_V03_<yyyy-mm-dd>.csv
        |__VEP_trialMeasures_V03_<yyyy-mm-dd>.csv
Output by task🔗
Click here for a data dictionary defining the fields in each .csv output file.
Faces task (FACE)🔗
1- FACE Trial Measures Output: sub-<ID>_ses-V03_task-FACE-ERPTrialMeasures.csv
Trial-level derivatives for the FACE task include mean amplitude.
| Variable Name | Description |
|---|---|
| Condition | inverted, object, uprightInv, uprightObj |
| TrialNum | trial index |
| MeanAmplitude_ |
Mean amplitude within specified time window at specified ROI |
2- FACE Summary Statistics Output: sub-<ID>_ses-V03_task-FACE-ERPSummaryStatistics.csv
Subject-level derivatives for the FACE task include mean amplitude and SME.
| Variable Name | Description |
|---|---|
| Condition | inverted, object, uprightInv, uprightObj |
| NTrials | number of trials retained per condition |
| MeanAmplitude_WindowStart-WindowEnd_ROI | Mean amplitude within specified time window at specified ROI |
| SME_WindowStart-WindowEnd_ROI | Standard measurement error during specified time window at specified ROI |
Mismatch Negativity (MMN)🔗
1- MMN Trial Measures Output: sub-<ID>_ses-V03_task-MMN-ERPTrialMeasures.csv
Trial-level derivatives for the MMN task include mean amplitude.
| Variable Name | Description |
|---|---|
| Condition | deviant, predeviant, standard |
| TrialNum | trial index |
| MeanAmplitude_WindowStart-WindowEnd_ROI | Mean amplitude within specified time window at specified ROI |
2- MMN Summary Statistics Output: sub-<ID>_ses-V03_task-MMN-ERPSummaryStatistics.csv
Subject-level derivatives for the MMN task include mean amplitude and SME.
| Variable Name | Description |
|---|---|
| Condition | deviant, predeviant, standard |
| NTrials | number of trials retained per condition |
| MeanAmplitude_WindowStart-WindowEnd_ROI | Mean amplitude within specified time window at specified ROI |
| SME_WindowStart-WindowEnd_ROI | Standard measurement error during specified time window at specified ROI |
Visual Evoked Potential (VEP)🔗
1- VEP Trial Measures Output: sub-<ID>_ses-V03_task-VEP-ERPTrialMeasures.csv
Trial-level derivatives for the VEP task include mean amplitude, adaptive mean (peak), and latency.
| Variable Name | Description |
|---|---|
| Condition | VEP |
| TrialNum | trial index |
| MeanAmplitude_WindowStart-WindowEnd_ROI | Mean amplitude within specified time window at specified ROI |
| Peak_WindowStart-WindowEnd_ROI | Adaptive mean amplitude within specified time window at specified ROI |
| Latency_WindowStart-WindowEnd_ROI | Latency to peak within specified time window at specified ROI |
2- VEP Summary Statistics Output: sub-<ID>_ses-V03_task-VEP-ERPSummaryStatistics.csv
Subject-level derivatives for the VEP task include SME, mean amplitude, adaptive mean (peak), and latency.
| Variable Name | Description |
|---|---|
| Condition | VEP |
| NTrials | number of trials retained per condition |
| SME_WindowStart-WindowEnd_ROI | Standard measurement error during specified time window at specified ROI |
| MeanAmplitude_WindowStart-WindowEnd_ROI | Mean amplitude within specified time window at specified ROI |
| Peak_WindowStart-WindowEnd_ROI | Adaptive mean amplitude within specified time window at specified ROI |
| Latency_WindowStart-WindowEnd_ROI | Latency to peak within specified time window at specified ROI |
Resting State🔗
- When interpreting the 50.0 Hz bin in RS output, please be aware that the data are low-pass filtered at 50Hz.
1- RS Absolute Power (μV²) Spectra Output: sub-<ID>_ses-V03_task-RS-AbsPowerSpectra.csv
Subject-level absolute power values for RS.
| Variable Name | Description |
|---|---|
| Row | Electrode |
| 1.0 Hz | Sum of absolute power in μV² centered at 1 Hz (within the 0.5hz to 1.5hz freq range) at corresponding electrode site |
| 2.0 Hz | Sum of absolute power in μV² centered at 2 Hz (within the 1.5hz to 2.5hz freq range) at corresponding electrode site |
| 3.0 Hz | Sum of absolute power in μV² centered at 3 Hz (within the 2.5hz to 3.5hz freq range) at corresponding electrode site |
| 50.0 Hz | Sum of absolute power in μV² centered at 50 Hz (within the 49.5hz to 50.5hz freq range) at corresponding electrode site |
2- RS Power (dB) Spectra Output: sub-<ID>_ses-V03_task-RS-dbPowerSpectra.csv
Subject-level dB power values for RS.
| Variable Name | Description |
|---|---|
| Row | Electrode |
| 1.0 Hz | Sum of power in dB centered at 1 Hz (within the 0.5hz to 1.5hz freq range) at corresponding electrode site |
| 2.0 Hz | Sum of power in dB centered at 2 Hz (within the 1.5hz to 2.5hz freq range) at corresponding electrode site |
| 3.0 Hz | Sum of power in dB centered at 3 Hz (within the 2.5hz to 3.5hz freq range) at corresponding electrode site |
| 50.0 Hz | Sum of absolute power in μV² centered at 50 Hz (within the 49.5hz to 50.5hz freq range) at corresponding electrode site |
3- RS Log Power Spectra Output: sub-<ID>_ses-V03_task-RS-LogPowerSpectra.csv
Subject-level log power values for RS.
| Variable Name | Description |
|---|---|
| Electrode | Electrode label |
| 1.0 Hz | Sum of natural log power centered at 1 Hz (within the 0.5hz to 1.5hz freq range) at corresponding electrode site |
| 2.0 Hz | Sum of natural log power centered at 2 Hz (within the 1.5hz to 2.5hz freq range) at corresponding electrode site |
| 3.0 Hz | Sum of natural log power centered at 3 Hz (within the 2.5hz to 3.5hz freq range) at corresponding electrode site |
| 50.0 Hz | Sum of absolute power in μV² centered at 50 Hz (within the 49.5hz to 50.5hz freq range) at corresponding electrode site |
4- RS Power Spectra .mat Output: sub-<ID>_ses-V03_task-RS_spectra.mat
Epoch-level derivatives for RS.
| Variable Name | Description |
|---|---|
| avg_abs_pow | Average absolute power (μV²) across epochs |
| avg_log_pow | Average natural log power across epochs |
| avg_db_pow | Average power (dB) across epochs |
| all_abs_power | Channels x abs power x epochs |
| all_log_power | Channels x log power x epochs |
| all_db_pow | Channels x dB power x epochs |
| epoch_level_abs_pow | Absolute power (μV²) for each epoch |
| epoch_level_log_pow | Log power for each epoch |
| epoch_level_db_pow | Power (dB) for each epoch |
| channel locations | ... |
| freqs | Frequency bins (1hz increments, 1-50hz) |
| n_epochs | Number of epochs |
| Fs | Sampling rate |
| num_channels | Number of channels |
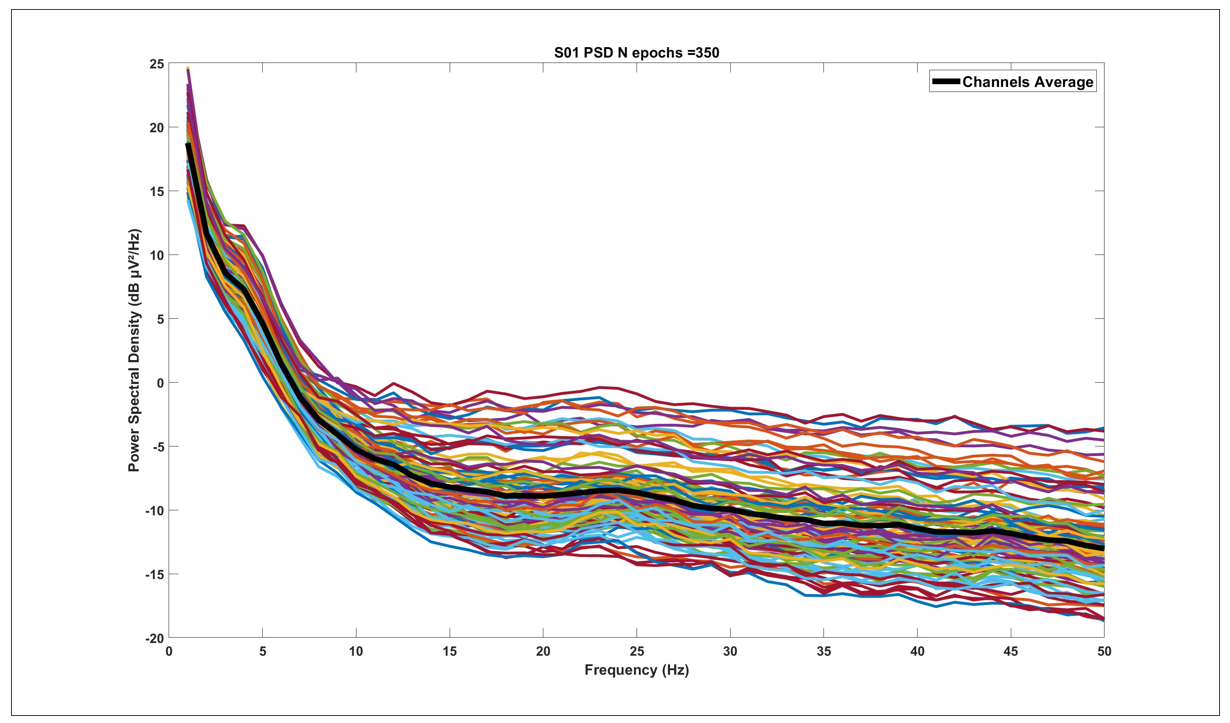
5- RS Power Spectra Figure : sub-<ID>_ses-V03_task-RS-desc-allCh_PSD.jpg
Subject-level plot visualizing power spectral density for each channel across the 1-50Hz frequency range. Data for this plot originates from sub-<ID>_ses-V03_task-RS-dbPowerSpectra.csv. See below for an example: